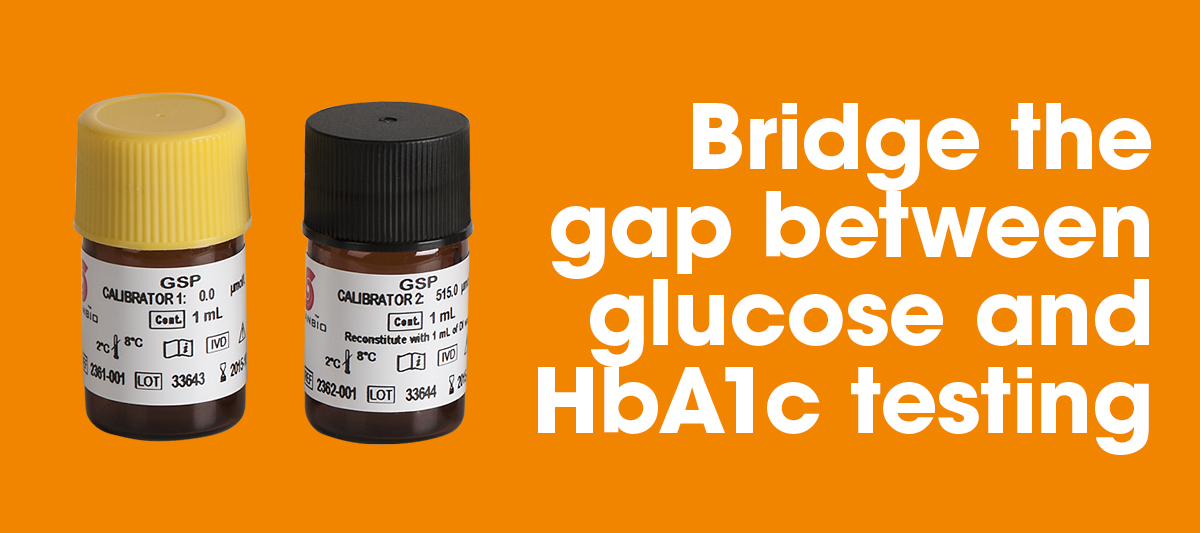
Glycated Serum Protein (GSP) LiquiColor® Assay

An introduction to Glycated Serum Protein
EKF Diagnostics’ Glycated Serum Protein (GSP) LiquiColor® Assay offers a two to three week indicator of average blood glucose. This closes the information gap between daily glucose levels and quarterly HbA1c testing.
EKF Diagnostics’ Glycated Serum Protein (GSP) LiquiColor® Assay offers a 2 – 3 week indicator of average blood glucose.
Glycated Serum Protein (GSP) serves as an accurate intermediate marker of glycemia in instances where HbA1c may be of limited value such as pregnancy, reduced RBC lifespan and hemodialysis.
The difference between actual measured HbA1c and predicted HbA1c from glycated serum protein is called the glycation gap.
Measuring HbA1c and Glycated Serum Protein (GSP) together offers improved diagnostic accuracy by more reliably predicting complications of diabetes including nephropathy and retinopathy.
Glycated Serum Protein (GSP) provides superior specificity and accuracy compared to fructosamine assays (NBT method) for monitoring and assessment of short-term to medium-term (past two to three week period) average blood glucose levels.
Complementary to HbA1c in diagnosis and screening of diabetes.
Studies suggest that combining Glycated Serum Protein (GSP) results with HbA1c measurements provides a better assessment of long term risk of diabetic complications.
| Methodology | Correlation to predicate method | Linearity | On-board stability* | Calibration | Sample type | Sample size* |
|---|---|---|---|---|---|---|
| Enzymatic | N = 65 R2 = 0.9966 Slope = 0.9542 Y intercept = 14.567 Range of values = 60-1249 µmol/L GSP |
21.0 to 1354.0 µmol/L | Four weeks at 2 – 8ºC | Two point Sold separately |
Serum | 10 µL |
* Analyzer dependent
| Control level 1 | Control level 2 | Serum level 1 | Serum level 2 | |
|---|---|---|---|---|
| N | 80 | 80 | 80 | 80 |
| Mean (µmol/L) | 204 | 751 | 251 | 373 |
| SD (µmol/L) | 2.2 | 4.9 | 1.9 | 2.4 |
| CV (%) | 1.1% | 0.7% | 0.8% | 0.6% |
| Control level 1 | Control level 2 | Serum level 1 | Serum level 2 | |
|---|---|---|---|---|
| N | 80 | 80 | 80 | 80 |
| Mean (µmol/L) | 204 | 751 | 251 | 373 |
| SD (µmol/L) | 2.4 | 5.6 | 3.2 | 3.7 |
| CV (%) | 1.2% | 0.7% | 1.3% | 1.0% |
Fructosamine and Glycated Albumin and risk of mortality and clinical outcomes in hemodialysis patients
T. Shafi et al
Serum Diabetes Care 36:15221533, 2013
Glycated Albumin is a better indicator for glucose xxcursion than Glycated Hemoglobin in Type 1 and Type 2 Diabetes.
Kazutoni Y. et al,
Endocrine Journal Vol. 55 (2008) No. 3 P 503-507.
Glycated Albumin and Risk of Death and Hospitalizations in Diabetic Dialysis Patients.
Barry I Freeman et al.
Clinical Journal of American Society of Nephrology, 6; 1-9, 2011.
Comparison of glycated albumin and hemoglobin A1c levels in diabetic subjects on hemodialysis.
TP Peacock et al.
Kidney International, 73: 1062-1068, 2008.
Effects of hemoglobin variants and chemically modified derivatives on assays for glycohemoglobin.
Bry L, Chen PC, Sacks DB.
Clinical Chemistry. 2001;47(2):153163.
American Diabetes Association Technical Review on Tests of Glycemia.
Goldstein DE, Little RR, Lorenz RA, Malone JI, Nathan D, Peterson CM.
Diabetes Care 1995;18:896-909.
Effect of age and race/ethnicity on HbA1c levels in people without known diabetes mellitus: implications for the diagnosis of diabetes.
Davidson MB1, Schriger DL.
DiabetesRes Clin Pract. 2010 Mar;87(3):415-21. doi: 10.1016/j.diabres.2009.12.013. Epub 2010 Jan 12.
Protein Glycation: Measurement and Clinical Relevance.
R. Schleicher and O.H Wieland.
J. Clin. Chem. Clin. Biochem. 27: 577-587, 1989.
Progression of Nephropathy in Type 2 Diabetes: The Glycation Gap Is a Significant Predictor after Adjustment for Glycohemoglobin (HbA1c).
Santiago Rodriguez-Segade et al.
Clinical Chemistry, 57-2, 264-271, 2011.
Discordance between HbA1c and Fructosamine. Evidence for a glycosylation gap and its relation to diabetic nephropathy.
Robert M. Cohen et al.
Diabetes Care, 26; 163-167, 2003.


